Basic algebra skills: Quadratic functions
 Quadratic functions and parabolas
We will now look at the properties of the graph of the quadratic function #a \cdot x^2+b \cdot x +c#. In addition, we will look at the points of intersection of the graphs of two quadratic functions.
A quadratic function #f# is given by #f(x)=ax^2+bx+c#, where #a#, #b# and #c# are real numbers and #a\neq 0#.
The graph associated with such a function is called a parabola.
When #a\gt0#, we speak of an upward opening parabola. When #a\lt0#, we speak of a downward opening parabola.
The parabola has a vertical axis of symmetry: #x=-\frac{b}{2a}#. Reflecting over this axis through the vertex leaves the graph unchanged.
If you rotate the graph in the plane, the shape remains the same, but it is no longer the graph of a function, because there are vertical lines that intersect the parabola twice. If we rotate any parabola in the plane so that the axis of symmetry is vertical, we get the familiar graph of a quadratic function.
To distinguish the graph of a quadratic function from an arbitrary parabola, we also speak of a vertical parabola if the axis of symmetry is vertical.
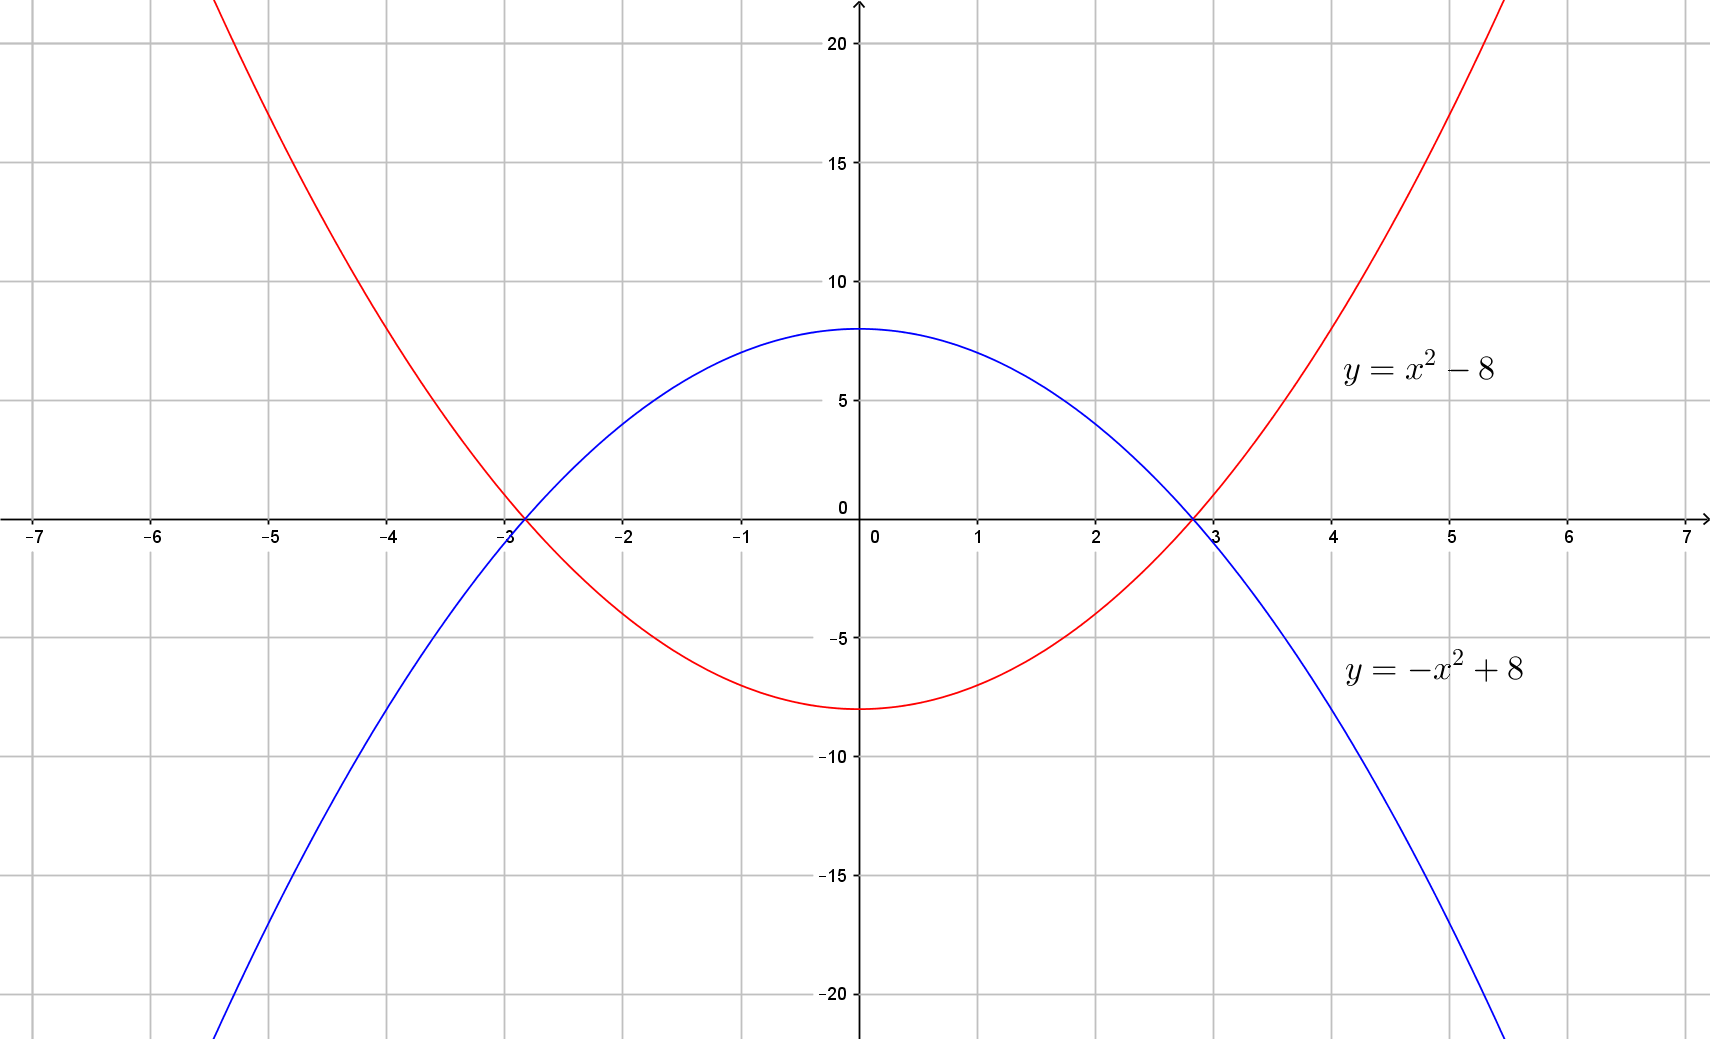
The meaning of these names becomes clear from the graph below of the upward opening parabola of #x^2-8# and the downward opening parabola of #-x^2+8#.
To find out what the zeros of a quadratic function are, we need to find the points of intersection of the parabola with the #x#-axis. This is done by solving a quadratic equation. We find the vertex by using the axis of symmetry at #x=-\frac{b}{2a}#.
Intersecting parabolas
Two vertical parabolas intersect at at most two points.
We will now look at some examples of graphs of quadratic functions.

The red points are the four requested points. These are calculated as follows:
The function is already written in the form #a \cdot x^2+b \cdot x +c# with #a =-1#, #b=-8# and #c=9#. Since #a<0# , the graph is a downward opening parabola.
The intersection with the #y# -axis is equal to the value of the constant in the quadratic function, and is therefore equal to #9#. The coordinates of the intersection with the #y# axis are therefore #\rv{0,9}#.
The #x# value of the vertex is given by #x=-\dfrac{b}{2 \cdot a}# and is therefore equal to:
\[\begin{array}{rclrl}
x&=& -\dfrac{-8}{2 \cdot -1} &&\phantom{xxx}\color{blue}{\text{formula filled in}}\\
&=& -4 &&\phantom{xxx}\color{blue}{\text{simplified}}\\
\end{array}\]
The #y# value of the vertex is calculated by entering #x=-4# in the formula. That gives:
\[\begin{array}{rclrl}
y&=& -\left(-4\right)^2 -8 \cdot -4 +9
&&\phantom{xxx}\color{blue}{\text{formula filled in}}\\
&=& \displaystyle 25 &&\phantom{xxx}\color{blue}{\text{calculated}}\\
\end{array}\]
The coordinates of the vertex are therefore: #\rv{-4,25}#.
The intersections with the #x# axis are the points for which #y=0# applies.
\[\begin{array}{rcl} -x^2-8\cdot x+9 &=& 0 \\&&\phantom{xxx}\color{blue}{\text{the equation to be solved}}\\
x=\dfrac{-{-8}-\sqrt{\left(-8\right)^2-4 \cdot -1 \cdot 9}}{2 \cdot -1} &\lor& x=\dfrac{-{-8}+\sqrt{\left(-8\right)^2-4 \cdot -1 \cdot 9}}{2 \cdot -1} \\&&\phantom{xxx}\color{blue}{\text{the quadratic formula filled in}}\\ \displaystyle x=-9 &\lor& \displaystyle x=1 \\&&\phantom{xxx}\color{blue}{\text{calculated}}\end{array}\]
The coordinates of the intersections with the #x# axis are therefore: #\rv{-9,0}# and #\rv{1,0}#.
So the following four points are the requested points in the graph: #\rv{0,9}#, #\rv{-4,25}#, #\rv{-9,0}# and #\rv{1,0}#.
The function is already written in the form #a \cdot x^2+b \cdot x +c# with #a =-1#, #b=-8# and #c=9#. Since #a<0# , the graph is a a downward opening parabola.
The requested points are connected in the figure by a smooth curve: the downward opening parabola given by the function prescription.