Quadratic equations: Drawing parabolas
 Drawing of parabolas
We have seen that the graph of a quadratic is a parabola. We have also seen how the intersection points with the axes, the vertex and other points with particular values of #x# of the parabola can be calculated. From these calculated values we can easily draw the graph of a quadratic.
Procedure drawing parabola
| Procedure |
geogebra plaatje
|
|
|
We will draw the graph of a quadratic. |
||
| Step 1 |
Determine the intersection point with the #y#-axis. |
|
| Step 2 |
Determine the vertex. |
|
| Step 3 |
Determine the intersection points with the #x#-axis, if there are any. |
|
| Step 4 |
Substitute values for #x# in the formula in such a way that we have at least 4 points we can draw. |
|
| Step 5 |
Draw these points in the coordinate system and connect them by a smooth parabola. |
\[y={{x^2}\over{4}}+5\cdot x-9\]
Draw the intersection with the #y#-axis, the vertex, and the intersections with the #x#-axis.
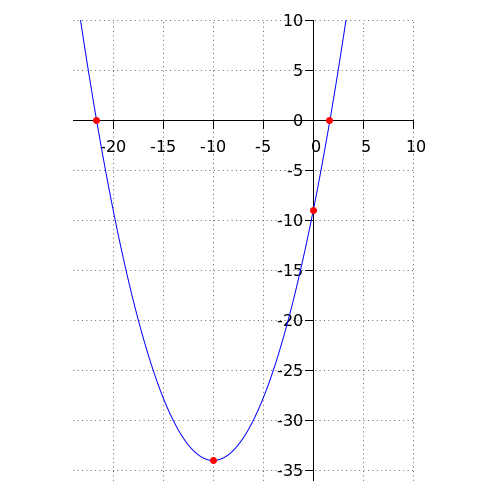
The red dots are the four dots from the question. These are calculated as follows:
The formula is already written in the form of #a \cdot x^2+b \cdot x +c# with #a ={{1}\over{4}}#, #b=5# and #c=-9#. Seeing as #a>0# the graph is a parabola that opens upward.
The intersection with the #y#-axis is equal to the value of the constant in the quadratic formula, which is equal to #-9#. That means that the coordinates of the intersection point with the #y#-axis are #\rv{0,-9}#.
The #x#-value of the vertex is given by #x=-\dfrac{b}{2 \cdot a}# and is equal to:
\[\begin{array}{rclrl}
x&=& -\dfrac{5}{2 \cdot {{1}\over{4}}} &&\phantom{xxx}\blue{\text{formula entered}}\\
&=& -10 &&\phantom{xxx}\blue{\text{simplified}}\\
\end{array}\]
The #y#-value of the vertex is calculated by entering #x=-10# in the formula. Which gives:
\[\begin{array}{rclrl}
y&=& {{1}\over{4}} \cdot \left(-10\right)^2 +5 \cdot -10 -9
&&\phantom{xxx}\blue{\text{formula entered}}\\
&=& -34 &&\phantom{xxx}\blue{\text{calculated}}\\
\end{array}\]
The coordinates of the vertex are: #\rv{-10,-34}#.
The intersections with the #x#-axis are the points that correspond to #y=0#.
\[\begin{array}{rcl}
{{x^2}\over{4}}+5\cdot x-9 &=& 0 \\&&\phantom{xxx}\blue{\text{the equation that should be calculated}}\\
x=\dfrac{-{5}-\sqrt{5^2-4 \cdot {{1}\over{4}} \cdot -9}}{2 \cdot {{1}\over{4}}} &\vee& x=\dfrac{-{5}+\sqrt{5^2-4 \cdot {{1}\over{4}} \cdot -9}}{2 \cdot {{1}\over{4}}} \\&&\phantom{xxx}\blue{\text{quadratic formula entered}}\\
x=-2\cdot \sqrt{34}-10 &\vee& x=2\cdot \sqrt{34}-10 \\&&\phantom{xxx}\blue{\text{calculated}}\\
\end{array}\]
The coordinates of the intersections with the #x#-axis are: #\rv{-2\cdot \sqrt{34}-10,0}# and #\rv{2\cdot \sqrt{34}-10,0}#. To draw the point in the graph, we have to write the coordinates as decimal numbers (rounded to 1 decimal). That gives:#\rv{-21.7,0}# and #\rv{1.7,0}#.
The four points in the graph are: #\rv{0,-9}#, #\rv{-10,-34}#, #\rv{-2\cdot \sqrt{34}-10,0}# and #\rv{2\cdot \sqrt{34}-10,0}#.
The requested points are connected by a smooth curve in the figure: the parabola that opens upward is given by the formula.